By Chris Heintz
[This article is part of a series, where aeronautical engineer Chris Heintz discusses light aircraft design and construction.]
The material in this article should provide you with even more in-depth information about your aircraft and its performance.
After you have completed the first flight of your aircraft (see The First Flight in this series), your next challenge is to get acquainted with your airplane in its various usual (and unusual) flight attitudes and landing conditions so that you feel fully comfortable in your aircraft and have full control over it at all times. Only the very first flight should be an exciting adventure. After that, flying your aircraft must become just an enjoyable routine - that's one of the reasons for the FAA's initial flight restrictions on homebuilts. But, of course, you will also do much "hangar flying," and when talking about your beautiful new aircraft you should state facts, not guesses; only with hard, true figures can you compare various aircraft.
The airspeed is perhaps the most controversial figure talked about and we will see how you can obtain the CAS (Corrected Air Speed) from your IAS (indicated Air Speed). The IAS is just what it says, "indicated," by your instrument. You want to know the corrections to be applied to your reading so that you will know exactly (within one or two miles) at what speed you are flying at a given altitude on a given day.
The following procedure will help you establish those figures:
- Select a straight stretch of road (or railway track) with easy marks (crossover, bridge, police speed marks, etc.) approximately 3/4 to 1-1/2 miles apart. Check the exact distance (D) on an accurate chart (or with your car, etc.). The stretch must be flat, and you do not want any obstructions for at least 2 miles on either end.
- The aircraft must be operating
well, and you have to know the following (i.e., you
need adequate instrumentation to obtain these
readings)
- aircraft weight (empty, plus fuel, plus occupants)
- aircraft center of gravity (in flight, not empty)
- outside temperature (Te)
- pressure altitude (Pa) - set the altimeter at 29.9 in. hg.
- indicated air speed (IAS)
- engine rpm
- engine manifold pressure (PM) if available
For comparisons the aircraft weight and CG are important as the performance may vary with both (more lift, thus higher drag for heavier weight and the contributing lift and drag of the tail depends on the aircraft CG position).
The required instrumentation is basic, except that manifold pressure may not be available. In this case you can either install one or you may not have enough information to determine your power setting (RPM is not enough).
Note:
- the altimeter must be set at the standard SL (sea level) for all these tests; and
- the outside temperature sensor gauge must be protected from wind and sun!
Finally to complete your test equipment you need a stopwatch and "ideal" weather; no wind and no turbulence: a windless early morning - e.i., usually anytime within two hours after sunrise provides excellent conditions.
The Tests
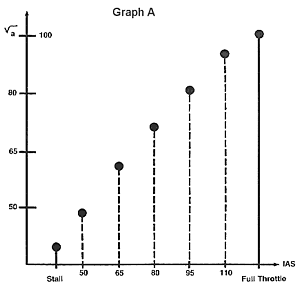
If your IAS stall speed is 40 and usual cruise 105 mph (adapt the figures to your aircraft) you will do the runs at 50, 65, 80, 95, 110 and full open. Those six runs done three times each will take close to one hour. Two minutes before you reach your first mark, set your speed and then don't touch the throttle again during all three runs at that speed (it may be 48 or 52 mph instead of the intended 50!). Write down on a prepared paper the IAS, Te, Pa, RPM, PM. Also note the date, weight, CG and weather conditions (slight wind, no wind, no clouds or structures, etc.)
Do all the runs at the same altitude (some 300 ft. AGL - above ground level) and fly the aircraft straight along your chosen track, keeping the altitude as constant as possible and measuring the time (T) between the chosen landmarks (over the distance - D). Each run consists of a back (T1) and forth (T2) over D (this minimizes wind influence) and as mentioned you do three runs at each speed with large 180 degree turns (no throttle change) at each end. All this requires a good pilot, especially at the lower speeds.
The Calculations
- Speed: For each
run you will have a T1 and T2.
The average measured speed will be:
a(i) = 1/2 x (d/ T1 + d/ T2) for each run. And the average run over the (say) 3 run is:
a = (a(1) + a(2) +a(3))/3.
Note: If the times T1 and T2 are more than five seconds different for consecutive runs, it is simply not accurate enough. Become a better pilot or wait for more favorable weather.
Now make a graph using the above calculated true speed over the IAS.

- Power: With an
aircraft engine, the manufacturer supplies a
"sea level and altitude performance" chart
in the operators manual: by using RPM, Pm and PA (you
may neglect the temperature correction if you are not
too far off standard atmosphere) you will find the
power setting for each run. Without Pm you cannot
know it!
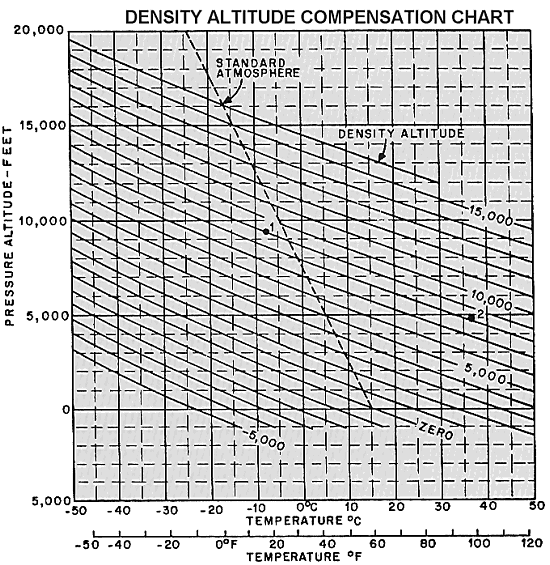
- Altitude: With Pa and Te you will find the density altitude, Pd, by using one of the modern flight computers or the FAA Density Altitude Compensation Chart reproduced below.
Now you can compare your aircraft with the figures given by others and especially the designer or manufacturer (or salesman):
For a given weight and balance and corrected to Sea Level for comparison with others, you use the speed chart.
The stall speed is extrapolated and again corrected to sea level.
For cruise speed comparison you need the power setting (75% or 65%); if not available use the full throttle speed which is practical as measured below 3,000 ft.: The available power has about the same correction as the speed below this altitude.
Until you have done all the above testing, do not come to the designer and tell him you've got a much better (or worse) aircraft than his prototype. Remember, only hard, true figures allow comparisons, and to obtain those figures is "hard work."
Good luck and enjoy those early morning performance runs.

To find density altitude, either at field elevation or while in flight, enter the graph with pressure altitude at left and temperature at base of graph. Read density altitude from the sloping lines where the temperature and pressure altitude lines cross. Pressure altitude for an airport is usually available at any briefing office. If pressure altitude is desired while in flight or on the ground when not otherwise available, it may be found from a pressure altimeter. To determine pressure altitude from the altimeter, place the altimeter setting indicator at standard sea level pressure (29.92 inches) and read the indicated altitude which will also be pressure altitude. (Corrections for instrumental error, if any, must be made.)
Example 1: With altimeter setting indicator at 29.92 inches, the altimeter reads 9,500 feet. Outside air temperature is -8 degrees C. Find 9,500 feet (pressure altitude) on the scale at the left side of the graph and follow it across the graph to where it crosses the -8 degree C. line. Density altitude is 9,000 feet (marked I on the graph).
Example 2: Density altitude is desired for take-off from an airfield at 5,300 feet with a runway temperature of 97 degrees F. (runway temperature is preferable to shelter temperature if available). The weather station furnishes a pressure altitude of 4,950 feet. Entering graph at 4,950 feet and moving across to 97 degrees F. indicates a density altitude of approximately 8,200 feet (marked 2 on graph). Note that in the warm air, although pressure altitude is lower than true altitude, density. altitude is considerably greater.
The Experimental Aircraft Association has excellent resources regarding flight testing your kit aircraft, including the highly recommended Flight Advisor Program.
